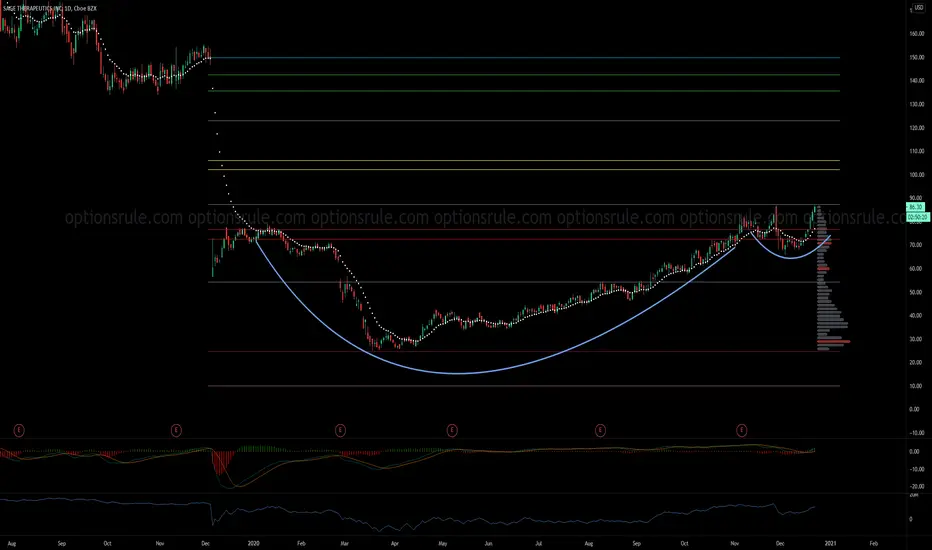
SAGE- will come back?SAGE- will come back?
-Doji candles at support.
-Key level.
-Demand zone.
-ABCD pattern.
-Fibo golden zone.
−9.05USD
−541.49 MUSD
86.46 MUSD
49.05 M
About Sage Therapeutics, Inc.
Sector
CEO
Barry E. Greene
Headquarters
Cambridge
Website
Employees (FY)
487
Founded
2010
ISIN
US78667J1088
FIGI
BBG0025X16Y5
SAGE Therapeutics, Inc. is a biopharmaceutical company, which engages in providing solutions to brain health medicines. It focuses on diseases and disorders of the brain. Its products include ZURZUVAE and ZULRESSO. The company was founded by Steven Marc Paul and Douglas Covey on April 16, 2010 and is headquartered in Cambridge, MA.

$SAGE: strong base, upcoming catalysts$SAGE is an interesting stock here, has pending catalysts for mid 2023, which fit the expectations from the Time@Mode technical pattern at hand here.
Consider the volatility of these biotech names when entering, stock could move huge after data comes out (up or down) but odds are good that it break

SAGE - longBig volume, end of the day Sep 17 shows that nstitutionals are buying.
There is a reason: SAGE receives Fast Track Designation for SAGE-718 for the Treatment of Huntington’s Disease
Technically looks strong: cap and handle pattern is bullish

Sage Therapeutics Receives Fast Track Designation for SAGE-718 fSAGE: Sage Therapeutics, Inc.
2021-09-15 06:30:00
Sage Therapeutics Receives Fast Track Designation for SAGE-718 for the Treatment of Huntington’s Disease


SAGE 62% PoP Bearish Iron Condor after event
My favorite bearish neutral trade for today.
Losing only upside, I like the extreme high IVR values to play.
Reasons to play this:
1/ After event, big selloff, high implied volatility.
2/ Extreme High Implied Volatility, good for credit strategies
3/ I can boost my original bearish vertical spread

$SAGE - obliterated earnings and dumped Could be a nice one to pick up on discount
Golden cross potential, no rush, wait for the trade to come to you
Looking to hold 80 then 82

$SAGE bullish RSI divergence The price seems to change it local downtrent direction to uptrand. We are going to 100$


See all ideas
Trade directly on the supercharts through our supported, fully-verified and user-reviewed brokers.


Frequently Asked Questions
The current price of SAGE is 12.57 USD — it has decreased by 19.58% in the past 24 hours.
Depending on the exchange, the stock ticker may vary. For instance, on NASDAQ exchange Sage Therapeutics, Inc. stocks are traded under the ticker SAGE.
Sage Therapeutics, Inc. is going to release the next earnings report on Apr 25, 2024. Keep track of upcoming events with our Earnings Calendar.
One year price forecast for Sage Therapeutics, Inc. has a max estimate of 70.00 USD and a min estimate of 14.00 USD.
SAGE earnings for the last quarter are −3.37 USD whereas the estimation was −2.68 USD which accounts for −25.60% surprise. Estimated earnings for the next quarter are −1.28 USD. See more details about Sage Therapeutics, Inc. earnings.
Sage Therapeutics, Inc. revenue for the last quarter amounts to 2.72 M USD despite the estimated figure of 4.63 M USD. In the next quarter revenue is expected to reach 61.03 M USD.
Yes, you can track Sage Therapeutics, Inc. financials in yearly and quarterly reports right on TradingView.
Like other stocks, SAGE shares are traded on stock exchanges, e.g. Nasdaq, Nyse, Euronext, and the easiest way to buy them is through an online stock broker. To do this, you need to open an account and follow a broker's procedures, then start trading. You can trade Sage Therapeutics, Inc. stock right from TradingView charts — choose your broker and connect to your account.
As of Apr 18, 2024, the company has 487.00 employees. See our rating of the largest employees — is Sage Therapeutics, Inc. on this list?
EBITDA measures a company's operating performance, its growth signifies an improvement in the efficiency of a company. Sage Therapeutics, Inc. EBITDA is −545.07 M USD, and current EBITDA margin is −630.47%. See more stats in Sage Therapeutics, Inc. financial statements.