$NYSE:RS good entry with tight stoplossNYSE:RS market is rotating away from tech and semi. It's will be a good entry here. The stock bouncing up strongly at SMA25.
22.88USD
1.34 BUSD
14.81 BUSD
56.99 M
About Reliance, Inc.
Sector
Industry
CEO
Karla Renee Lewis
Website
Headquarters
Scottsdale
Employees (FY)
15 K
Founded
1939
ISIN
US7595091023
FIGI
BBG000CJ2181
Reliance, Inc. engages in the provision of a metal distribution center. It offers alloy, aluminum, brass, copper, carbon steel, stainless steel, titanium, and specialty steel products. The company was founded by Thomas J. Neilan on February 3, 1939, and is headquartered in Scottsdale, AZ.

RS Intuition stock longer term shortI've had some personal drama going on lately and just haven't been motivated to journal, but this name has history with me as it's the first ticker that ever came into my head once I tried to actually acquire information from "beyond". That was in 2018 when this was only $92!
I was kind of excited w

Reliance Steel (RS) WeeklyWhat is not to like about this chart. 30.08 ROE, low debt ratios, good margins and cash flow. Solid trend on weekly, looking for starter entry around the dashed red line or the top of the cloud (198.69).

$RS with a Bullish outlook following its earnings #Stocks The PEAD projected a Bullish outlook for $RS after a Positive Under reaction following its earnings release placing the stock in drift A with an expected accuracy of 100%.

3/20/22 RSReliance Steel & Aluminum Co. ( NYSE:RS )
Sector: Non-Energy Minerals (Steel)
Market Capitalization: $11.816B
Current Price: $191.50
Breakout price: $192.00
Buy Zone (Top/Bottom Range): $187.50-$181.50
Price Target: $209.20-$210.90
Estimated Duration to Target: 68-70d
Contract of Interest: $RS 6/

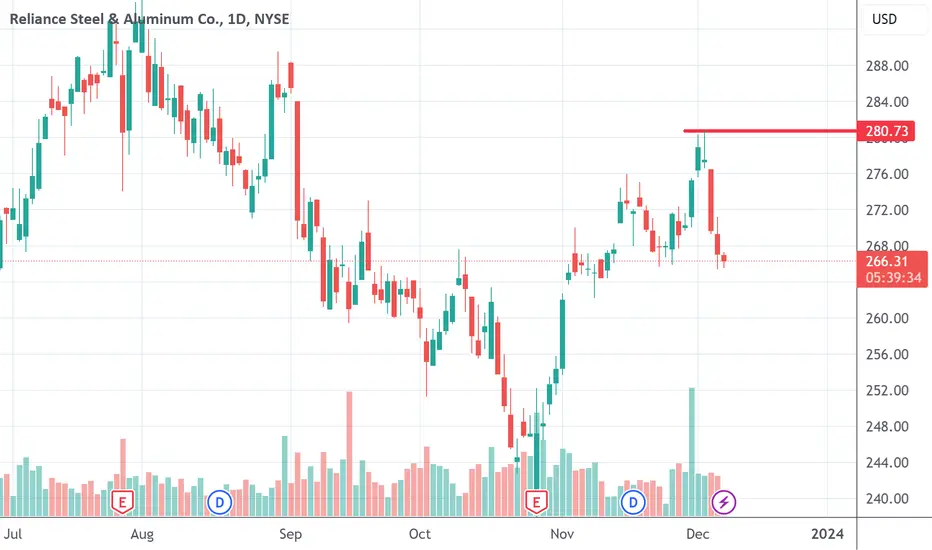
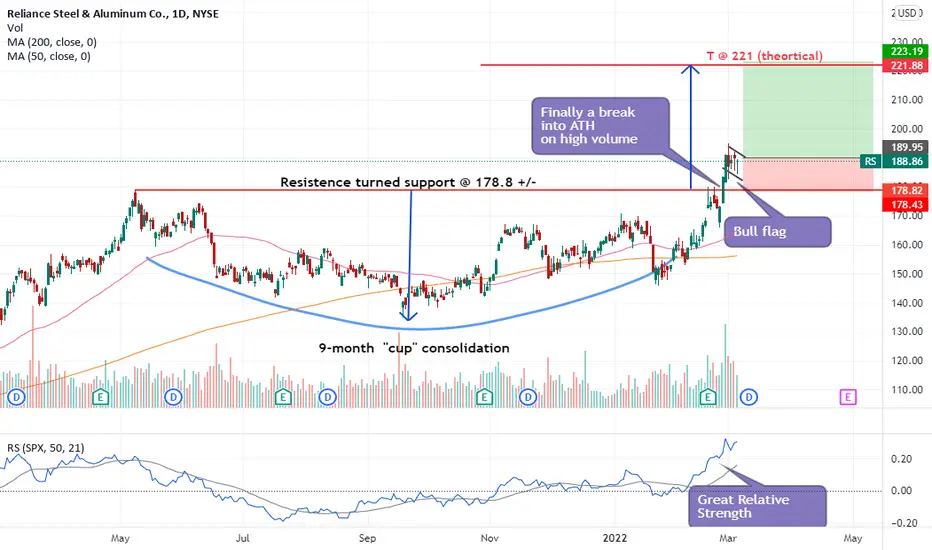
RS - Bull FlagBroke up into ATH (All-time-high) on 28 Feb on strong volume. Have been forming a bull flag since. Buy the next break up of this bull flag as the momentum remains strong.
p/s I may also attempt to buy if it retest the resistence turned support level around 179-179 with a tight stop loss slightly b
$RS Large 8 Months Base$RS in the steel space setting a big 8 months base and now tightening up on the right side.
Once that I am watching closely.
Solid Earnings and Sales numbers.

LONG RS BIG+% returnsSTEEL AND ALUMINIUM obvious long term hold 6 months out expect massive returns with fairly good risk

RELIANCE STELL & ALUMINIUM Analysis DailyHey guys, RELIANCE STELL & ALUMINIUM is in a very important moment in its history we can witness a new historical high. It is in a bearish dynamic fake with a water-carrying candle shape followed by a bearish trace and a fake return of traded sell volume. The TIMEFRAME M1 shows a marubozu with an ex

See all ideas
Trade directly on the supercharts through our supported, fully-verified and user-reviewed brokers.


Frequently Asked Questions
The current price of RS is 322.12 USD — it has decreased by 0.24% in the past 24 hours.
Depending on the exchange, the stock ticker may vary. For instance, on NYSE exchange Reliance, Inc. stocks are traded under the ticker RS.
Reliance, Inc. is going to release the next earnings report on Apr 25, 2024. Keep track of upcoming events with our Earnings Calendar.
RS stock is 1.50% volatile and has beta coefficient of 0.88. Check out the list of the most volatile stocks — is Reliance, Inc. there?
One year price forecast for Reliance, Inc. has a max estimate of 380.00 USD and a min estimate of 340.30 USD.
RS earnings for the last quarter are 5.00 USD whereas the estimation was 5.00 USD which accounts for −0.04% surprise. Estimated earnings for the next quarter are 3.92 USD. See more details about Reliance, Inc. earnings.
Reliance, Inc. revenue for the last quarter amounts to 3.62 B USD despite the estimated figure of 3.61 B USD. In the next quarter revenue is expected to reach 3.31 B USD.
Yes, you can track Reliance, Inc. financials in yearly and quarterly reports right on TradingView.
RS stock has fallen by 2.78% compared to the previous week, the month change is a 0.56% fall, over the last year Reliance, Inc. has showed a 29.78% increase.
RS net income for the last quarter is 272.70 M USD, while the quarter before that showed 295.00 M USD of net income which accounts for −7.56% change. Track more Reliance, Inc. financial stats to get the full picture.
Today Reliance, Inc. has the market capitalization of 18.50 B, it has increased by 1.20% over the last week.
Yes, RS dividends are paid quarterly. The last dividend per share was 1.10 USD. As of today, Dividend Yield (TTM)% is 1.27%. Tracking Reliance, Inc. dividends might help you take more informed decisions.
Reliance, Inc. dividend yield was 1.43% in 2023, and payout ratio reached 17.67%. The year before the numbers were 1.73% and 11.70% correspondingly. See high-dividend stocks and find more opportunities for your portfolio.
Like other stocks, RS shares are traded on stock exchanges, e.g. Nasdaq, Nyse, Euronext, and the easiest way to buy them is through an online stock broker. To do this, you need to open an account and follow a broker's procedures, then start trading. You can trade Reliance, Inc. stock right from TradingView charts — choose your broker and connect to your account.
As of Apr 18, 2024, the company has 15.00 K employees. See our rating of the largest employees — is Reliance, Inc. on this list?
Investing in stocks requires a comprehensive research: you should carefully study all the available data, e.g. company's financials, related news, and its technical analysis. So Reliance, Inc. technincal analysis shows the neutral today, and its 1 week rating is buy. Since market conditions are prone to changes, it's worth looking a bit further into the future — according to the 1 month rating Reliance, Inc. stock shows the buy signal. See more of Reliance, Inc. technicals for a more comprehensive analysis.
If you're still not sure, try looking for inspiration in our curated watchlists.
If you're still not sure, try looking for inspiration in our curated watchlists.
We've gathered analysts' opinions on Reliance, Inc. future price: according to them, RS price has a max estimate of 380.00 USD and a min estimate of 340.30 USD. Read a more detailed Reliance, Inc. forecast: see what analysts think of Reliance, Inc. and suggest that you do with its stocks.
EBITDA measures a company's operating performance, its growth signifies an improvement in the efficiency of a company. Reliance, Inc. EBITDA is 1.98 B USD, and current EBITDA margin is 13.41%. See more stats in Reliance, Inc. financial statements.