PII - Bottom Setup10/20EMA cross with average volume increasing + forming a handle above the 50DMA. It has been months since the Relative Strength turned positive. With sector rotation this could see a nice move off these levels.
10EMA - White
20EMA - Blue
50DMA - Green
200DMA - Purple
8.81USD
502.80 MUSD
8.93 BUSD
52.94 M
About Polaris Inc.
Sector
Industry
CEO
Michael Todd Speetzen
Website
Headquarters
Medina
Employees (FY)
18.5 K
Founded
1954
ISIN
US7310681025
FIGI
BBG000D5S4M0
Polaris Inc. engages in designing, engineering, and manufacturing power sports vehicles. It operates through the following segments: Off-Road, On-Road, and Marine. The Off-Road segment includes off-road vehicles (ORV) and snowmobiles. The On Road segment is involved in the design and manufacture of motorcycles, motorbikes, light duty hauling, and passenger vehicles. The Marine segment focuses on the design and manufacture of boats. The company was founded by Edgar E. Hetteen, Allan Hetten, and David Johnson in 1954 and is headquartered in Medina, MN.


PII Long
PII far below norm P/E ratio with 2% dividend yield. New highs would be the start of a nice bull run, imo. Also a very niche sector.

Polaris (PII)... A Star to show the WayI like concurrent Harmonic patterns
Polaris has recently completed both Bullish Bat and Gartley Patterns
I would like to buy under $122. with a stop at 117.25.
This produces a return of 2.2x and 3.6x at TP1 and TP2 respectively.
As always do your own due dilegence and we need the broad market a

$PII Pennant and consolidation Breakout$PII
Chart
Pennant breakout
Consolidation breakout
Volume dry up during pullback within consolidation
RS Rating 70/ Blue Dot (New High)
Long term High $137.66 (>1yr Base)
Above KMA's
RSI Hidden bullish divergence
Fundamentals
EPS, Sales & fund ownership rising
Big name fu

Polaris is holding up very well and flaggingNYSE:PII is holding up well and flagging. We successfully traded this from 104$ to 129$ and it is still looking bullish. Long the flag break out to target 135.3$ and 156.5$, stop around 108$.
Hit the like button and follow if you find this useful :)
This is only my own view and not financial advice

$PII with a neutral outlook following its earnings #BeststocksThe PEAD projected a neutral outlook for $PII after a positive over reaction following its earnings release placing the stock in Drift B
If you would like to see the Drift for another stock please message us. Also click on the Like Button if this was useful and follow us or join us.

Polaris broke out of pennant patternNYSE:PII broke out of the pennant pattern and is now targeting 111$ ~ 112$ and then the sell at around 130$, any pullback is considered a buying opportunity. Stop level around 86$.
Hit the like button and follow if you find this useful :)
This is only my own view and not financial advice, do your o

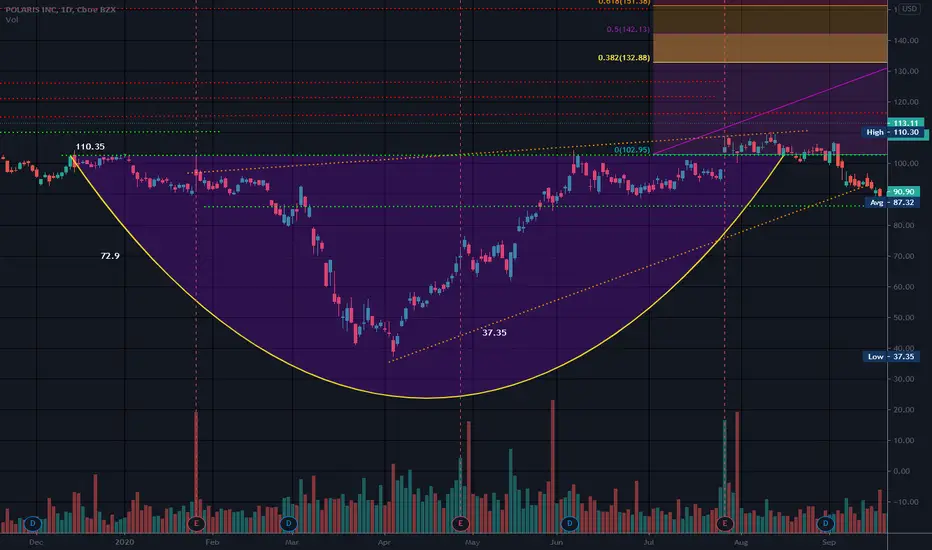
Cup and Handle Earnings 1-26 BMOPrior highs that may cause resistance over head/fell from a rising wedge and seems to have recovered.
Earnings 1-26 BMO
3 year high is 137.66 Long term high is 159.33
Cup low is 37.35 Cup depth is 72.9 which is deep but R overhead. Targets are calculated using cup depth and fib levels. In a b
POLARIS Opportunity DailyHello traders, POLARIS is in a fake bullish compossion with high volume buying and a shadow of sellers. By looking at the TIMEFRAME M1 we see a hammer candle with a large volume of purchases traded, it has come to test the range. It is very plausible to break the price with the current momentum then

See all ideas
Trade directly on the supercharts through our supported, fully-verified and user-reviewed brokers.


Curated watchlists where PII is featured.

Frequently Asked Questions
The current price of PII is 86.53 USD — it has decreased by 0.27% in the past 24 hours.
Depending on the exchange, the stock ticker may vary. For instance, on NYSE exchange Polaris Inc. stocks are traded under the ticker PII.
Polaris Inc. is going to release the next earnings report on Apr 23, 2024. Keep track of upcoming events with our Earnings Calendar.
PII stock is 2.98% volatile and has beta coefficient of 1.74. Check out the list of the most volatile stocks — is Polaris Inc. there?
One year price forecast for Polaris Inc. has a max estimate of 120.00 USD and a min estimate of 75.00 USD.
PII earnings for the last quarter are 2.71 USD whereas the estimation was 2.71 USD which accounts for −0.08% surprise. Estimated earnings for the next quarter are 2.56 USD. See more details about Polaris Inc. earnings.
Polaris Inc. revenue for the last quarter amounts to 2.25 B USD despite the estimated figure of 2.26 B USD. In the next quarter revenue is expected to reach 2.24 B USD.
Yes, you can track Polaris Inc. financials in yearly and quarterly reports right on TradingView.
PII stock has fallen by 6.59% compared to the previous week, the month change is a 3.46% fall, over the last year Polaris Inc. has showed a 20.72% decrease.
PII net income for the last quarter is 103.40 M USD, while the quarter before that showed 151.70 M USD of net income which accounts for −31.84% change. Track more Polaris Inc. financial stats to get the full picture.
Today Polaris Inc. has the market capitalization of 4.90 B, it has increased by 0.44% over the last week.
Yes, PII dividends are paid quarterly. The last dividend per share was 0.66 USD. As of today, Dividend Yield (TTM)% is 3.01%. Tracking Polaris Inc. dividends might help you take more informed decisions.
Polaris Inc. dividend yield was 2.74% in 2023, and payout ratio reached 29.84%. The year before the numbers were 2.53% and 26.09% correspondingly. See high-dividend stocks and find more opportunities for your portfolio.
Like other stocks, PII shares are traded on stock exchanges, e.g. Nasdaq, Nyse, Euronext, and the easiest way to buy them is through an online stock broker. To do this, you need to open an account and follow a broker's procedures, then start trading. You can trade Polaris Inc. stock right from TradingView charts — choose your broker and connect to your account.
As of Apr 18, 2024, the company has 18.50 K employees. See our rating of the largest employees — is Polaris Inc. on this list?
Investing in stocks requires a comprehensive research: you should carefully study all the available data, e.g. company's financials, related news, and its technical analysis. So Polaris Inc. technincal analysis shows the sell today, and its 1 week rating is sell. Since market conditions are prone to changes, it's worth looking a bit further into the future — according to the 1 month rating Polaris Inc. stock shows the sell signal. See more of Polaris Inc. technicals for a more comprehensive analysis.
If you're still not sure, try looking for inspiration in our curated watchlists.
If you're still not sure, try looking for inspiration in our curated watchlists.
We've gathered analysts' opinions on Polaris Inc. future price: according to them, PII price has a max estimate of 120.00 USD and a min estimate of 75.00 USD. Read a more detailed Polaris Inc. forecast: see what analysts think of Polaris Inc. and suggest that you do with its stocks.
EBITDA measures a company's operating performance, its growth signifies an improvement in the efficiency of a company. Polaris Inc. EBITDA is 886.00 M USD, and current EBITDA margin is 9.94%. See more stats in Polaris Inc. financial statements.