More downside is needed for small capsDon't be fooled by the 4.6% gain on Mar 28 (last trading day of March). Unless it is followed by another day of further upside, I believe that it would need to go down more to finish the WXY correction. The same pattern with the IWM and other small caps.
16.75USD
465.37 MUSD
4.03 BUSD
27.52 M
About M/I Homes, Inc.
Sector
Industry
CEO
Robert H. Schottenstein
Website
Headquarters
Columbus
Employees (FY)
1.61 K
Founded
1976
ISIN
US55305B1017
FIGI
BBG000BL9MZ4
M/I Homes, Inc. engages in the construction and development of residential properties. It operates through the Homebuilding and Financial Services segments. The Homebuilding segment includes Northern and Southern Homebuilding which designs, markets, constructs, and sells single-family homes and attached townhomes to first-time, millennial, move-up, empty-nester, and luxury buyers. The Financial Services segment offers mortgage banking services to homebuyers. The company was founded by Irving Schottenstein and Melvin Schottenstein in 1976 and is headquartered in Columbus, OH.

Momentum Stock - M/I HomesM/I Homes, Inc . is a leading US-based home construction company that offers comprehensive homebuying experiences, including financing. Its long-standing market presence, consistent growth, robust financial performance, and commitment to sustainable practices make it a compelling option for investor

M/I Homes Announces $100 million Increase to Share Repurchase AuMHO: M/I Homes, Inc.
2022-02-17 16:00:00
M/I Homes Announces $100 million Increase to Share Repurchase Authorization

[TRADE IDEA] MHO STOCK BULLISH- Break of Market structure
- Low volume on retrace
- Bullish orderblock for entry

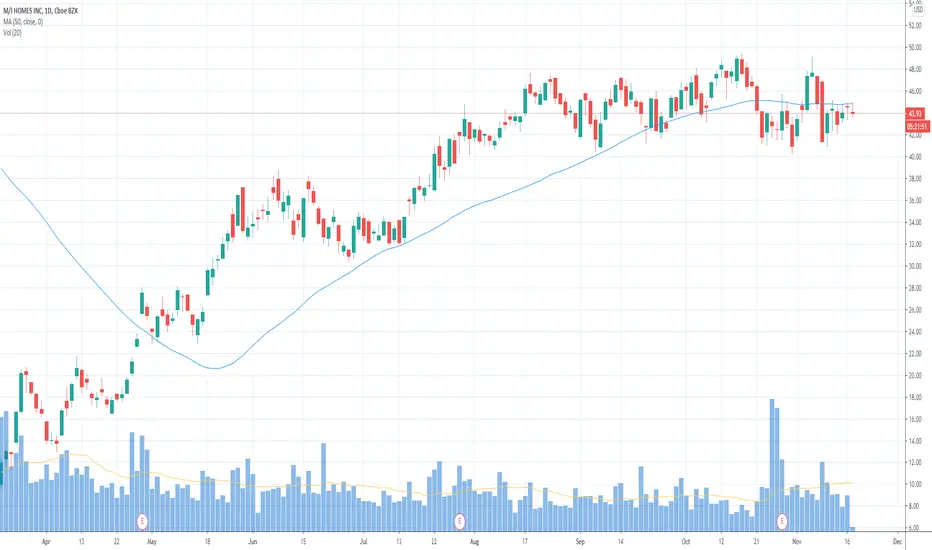
V BottomV bottoms do have a true handle but there is a channel of support that has formed..
V bottoms come down in an almost straight channel as a rule and go back up the same way, without a lot of pauses...The trend back up is almost a mirror of the trend down. Price drops at an almost 45 degree angle. T

$MHOEntry price : 44.90
Fundamentals :
- Sector: Building
- EPS % Chg (Last Qtr): 90%
- 3 Year EPS Growth Rate: 32%
- EPS Est % Chg (Current Yr): 71%
- Sales % Chg (Last Qtr): 30%
- 3-Year Sales Growth Rate: 14%
- Annual Pre -Tax Margin: 6.9%
Technicals : Hammer/Support


MHO - abive resistancesimple trade
go long on MHO after breaking above resistance and testing the level that acted as support

See all ideas
Trade directly on the supercharts through our supported, fully-verified and user-reviewed brokers.


Frequently Asked Questions
The current price of MHO is 115.55 USD — it has decreased by 1.88% in the past 24 hours.
Depending on the exchange, the stock ticker may vary. For instance, on NYSE exchange M/I Homes, Inc. stocks are traded under the ticker MHO.
M/I Homes, Inc. is going to release the next earnings report on Apr 24, 2024. Keep track of upcoming events with our Earnings Calendar.
One year price forecast for M/I Homes, Inc. has a max estimate of 116.00 USD and a min estimate of 116.00 USD.
MHO earnings for the last quarter are 4.82 USD whereas the estimation was 4.27 USD which accounts for 12.88% surprise. Estimated earnings for the next quarter are 4.94 USD. See more details about M/I Homes, Inc. earnings.
M/I Homes, Inc. revenue for the last quarter amounts to 1.05 B USD despite the estimated figure of 1.07 B USD. In the next quarter revenue is expected to reach 1.19 B USD.
Yes, you can track M/I Homes, Inc. financials in yearly and quarterly reports right on TradingView.
Like other stocks, MHO shares are traded on stock exchanges, e.g. Nasdaq, Nyse, Euronext, and the easiest way to buy them is through an online stock broker. To do this, you need to open an account and follow a broker's procedures, then start trading. You can trade M/I Homes, Inc. stock right from TradingView charts — choose your broker and connect to your account.
As of Apr 16, 2024, the company has 1.61 K employees. See our rating of the largest employees — is M/I Homes, Inc. on this list?
EBITDA measures a company's operating performance, its growth signifies an improvement in the efficiency of a company. M/I Homes, Inc. EBITDA is 596.32 M USD, and current EBITDA margin is 14.80%. See more stats in M/I Homes, Inc. financial statements.