GBPUSD for bearishIm looking for shorting this pair. Possible impulsive down.. Trade with your own risk.
USDGBP trade ideas

GBP/USD - Buy zone!Hi there!
I'm buying the GBP/USD :
-RMID (Range Manipulation Initiation Distribution)
-We have liquidity.
-We have an interesting zone.
-We have the optimal fibo.
-We have accumulation before/on the zone.
-We are with the trend.

GBPUSD Multi TF Analysis 28/5/2024SL - 1.27310
TP - 1.28705
1M price chasing up.
1W price in strong strength.
Channel up.

CHART BREAKDOWN GBPUSD: Key Levels, Targets and Thoughts!🎯Brief Description🖊️:
The chart provides insights into critical market levels, emphasizing an essential demand zone (low-risk buy zone) spanning from 1.26000 to 1.25900. Additionally, medium-risk buy zone between 1.26570-1.26470, respectively, are highlighted.
Things I Have Seen👀:
Important Demand Zone🟢: Identified between 1.26000 and 1.25900, serving as a low-risk buy.
Medium-Risk Buy Zone🟠: Noted between 1.26570 and 1.26470, suggesting another area with moderate risk for potential buying positions.
Bullish Targets📈:
1.26200: Possible retracement area.
1.26500: Possible retracement area.
1.26750: Significant supply zone.
1.27600: Liquidity area.
What's Important Now❗
Currently, the crucial approach is to wait and observe the price action at this level. We need to assess how the market reacts before considering any decisive moves. Stay observant and responsive to real-time developments in the market.
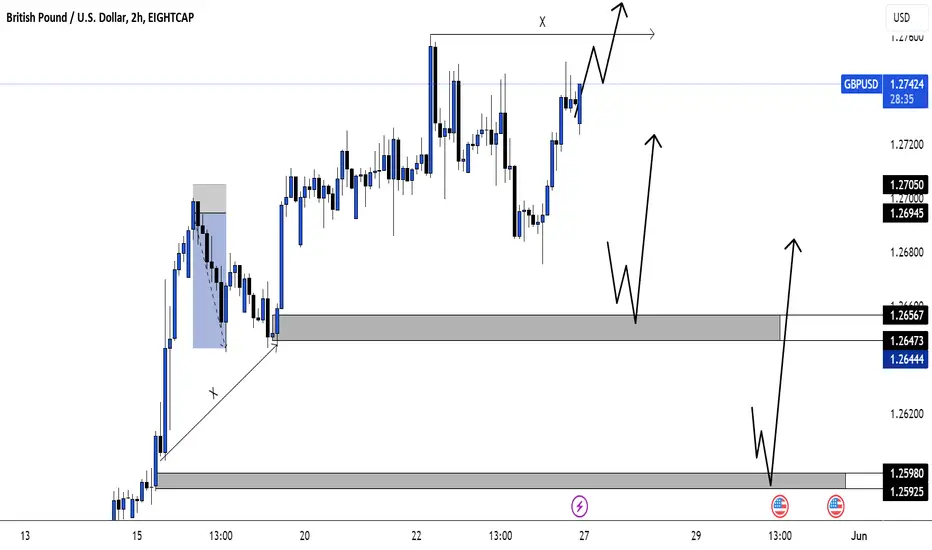
CHART BREAKDOWN GBPUSD: Key Levels, Targets and Thoughts!🎯Brief Description🖊️:
The chart provides insights into critical market levels, emphasizing an essential demand zone (low-risk buy zone) spanning from 1.25450 to 1.25350. Additionally, medium-risk buy zone between 1.26000-1.25900, respectively, are highlighted.
Things I Have Seen👀:
Important Demand Zone🟢: Identified between 1.25450 and 1.25350, serving as a low-risk buy.
Medium-Risk Buy Zone🟠: Noted between 1.26000 and 1.25900, suggesting another area with moderate risk for potential buying positions.
Bullish Targets📈:
1.25500: Possible retracement area.
1.25900: Possible retracement area.
1.26200: Possible retracement area.
1.26750: Significant supply zone.
1.27000: Liquidity area.
What's Important Now❗
Currently, the crucial approach is to wait and observe the price action at this level. We need to assess how the market reacts before considering any decisive moves. Stay observant and responsive to real-time developments in the market.

GBPUSD is about to test an upward price channelConan hello everyone!
Now, GBP/USD extends gains for the second straight session, trading around 1.2710 during Asian hours on Monday. A weaker US dollar supports the pair. Sterling may face a challenge as the BoE is expected to cut interest rates by 60 basis points in 2024.
With the current uptrend remaining stable and the EMA 34.89 showing no signs of reversal, this is a supporting factor for this pair, helping to reduce short-term risks. Meanwhile, buyer confirmation above 1.2635 resistance is allowing technical buyers to materialize a bullish phase. Fundamentally and technically the market is showing positivity, these factors are currently the main drivers supporting the pair to test the limits of the 1.2855 channel at least.

GBP/USD SWING SHORT We are currently bearish on the daily timeframe and price just came into a very strong resistance level/order block with the daily stochastic RSI in the way overbought territory. I am in on shorts from 1.27500 and looking to hold it unless price says otherwise.

H4 Bearish Trend GBPUSDGBPUSD had HTF strong bearish trend which was confirmed by H4 ChoCh. Now the market has succeeded pullback to 75% Fibo level or 388 level of Fibo extension. My analysis, GU will continue the bearish trend & retest the unmitigated shadow on 24500-25000 level.
*disclaimer ON *DYOR

GBPUSD. Weekly trading levels 27 - 31.05.2024During the week you can trade from these price levels. Finding the entry point into a transaction and its support is up to you, depending on your trading style and the development of the situation. Zones show preferred price ranges WHERE to look for an entry point into a trade.
If you expect any medium-term price movements, then most likely they will start from one of the zones.
Levels are valid for a week, the date is in the title. Next week I will adjust the levels based on new data and publish a new post.
! Please note that brokers have a difference in quotes, take this into account when trading.
The history of level development can be seen in my previous posts. They cannot be edited or deleted. Everything is fair. :)
----------------------------------------------
I don’t play guess the direction (that’s why there are no directional arrows), but zones (levels) are used for trading. We wait for the zone to approach, watch the reaction, and enter the trade.
Levels are drawn based on volumes and data from the CME. They are used as areas of interest for trading. Traded as classic support/resistance levels. We see the reaction to the rebound, we trade the rebound. We see a breakout and continue to trade on a rollback to the level. The worst option is if we revolve around the zone in a flat.
Do not reverse the market at every level; if there is a trend movement, consider it as an opportunity to continue the movement. Until the price has drawn a reversal pattern.
Don't forget to like Rocket and Subscribe!!! Feedback is very important to me!

BEARISH GBPUSDi am more interested in this pair, where the price action is very clean. buyside is being taking out creating structure to the downside. once is it is formed , then it is likely to retrace at least to the c.e point ( mid point of the pd array. sell from premium level

idea on a trade GBP USDWe have a great set up here where price could go.GBP/USD closed in negative territory on Thursday and snapped a four-day winning streak. After touching its lowest level in a week below 1.2680 in the early European session on Friday, the pair recovered to the 1.2700 area.

DeGRAM | GBPUSD double top at the channel boundaryGBPUSD is moving in an ascending channel above the trend lines.
The price has reached the upper boundary twice, forming a double top.
The chart has formed a pattern AB=CD.
We expect a pullback after consolidation under the trend line.
-------------------
Share your opinion in the comments and support the idea with a like. Thanks for your support!

GBPUSD = SELL📊📈💸Look at the DAILY scenario price has a premium zone with a rejection wick, a confirmation for a reversal, you can look for a market structure shift or an aggressive entry for SELL'S

GBPUSD SHORT IDEAFX:GBPUSD is currently at its 0.78 Fib level on a daily timeframe and forming a bearish divergence at the 1-hour mark. After observing a Break of Structure (BOS), we will enter a short position at the 0.5 fib retracement with a stop loss at a recent high, targeting a 1:2 risk-reward ratio.

British pound buyers pressure to set new recordBy examining the trend in the four-hour time frame, the British pound, on the condition of maintaining and not registering any close candle time of four hours under the support of 1.2729, the rate can increase up to the resistance range of the ascending channel ceiling in the range of 1.2823-1.2814.

✅GBP_USD WILL GO UP|LONG🚀
✅GBP_USD is trading in
An uptrend and the pair
Made a rebound from the
Horizontal support of 1.2700
So we are bullish biased
And we will be expecting
A further move up
LONG🚀
✅Like and subscribe to never miss a new idea!✅

GBP/USD: Bearish Momentum Anticipated After Bullish SurgeHello Everyone,
After a significant uptrend in GBP/USD, the market sentiment is shifting towards an expected return to bearish territory.
TradeWithTheTrend3344

Sell GBPUSD CPI DataThe GBP/USD pair on the M30 timeframe presents a potential shorting opportunity due to a recent breakout from a wedge pattern.
Possible Short Trade :
Entry: Consider entering a short position (selling GBP/USD) below the broken support trendline of the wedge after confirmation. Ideally, this would be around 1.2720 or lower if the price continues to decline.
Target Levels:
1.2678: This target is achieved by measuring the height of the wedge (from its apex to the breakout point) and projecting it downwards from the breakout point.
1.2650: This is a further extension of the downside target, based on the height of the recent price movement before the breakout.
Stop-Loss: Once the entry point is confirmed, place a stop-loss order above the broken support line of the wedge, ideally with some buffer around 1.2730. This helps limit potential losses if the price unexpectedly reverses and breaks back upwards.
Thank you.

GBPUSD rallied early on TuesdayGBP/USD rallied early on Tuesday, briefly reaching its highest point since March 21, but gains were short-lived as sellers quickly pushed the pair down from the psychological 1.2800 level, driving it towards 1.2755. If this ceiling holds in the near term, bulls may start bailing, creating the right conditions for a move toward 1.2700. Further weakness could shift focus to 1.2635.
Conversely, if buyers manage to reclaim dominance in the coming days and take out resistance at 1.2800, the upward momentum could intensify, propelling GBP/USD towards 1.2895 – the March peak. While overcoming this ceiling might be difficult, it is still feasible. On that note, upside clearance of this barrier could result in a rally towards the 1.3000 handle.

GBP/USD back in the rangeGBPUSD has broken above the 1.26 level following the CPI data from last week which resulted in DXY losses.
Expect price to continue up to the 1.28 level.
Await short term price action above or below the previous day high/low (PDH/PDL) before entering long orders.

$GBP - What shall we do now?$GBP - What shall we do now?
GBP - Since we hit below 1.14 - 1.10 it's really been a one way for this pair and it could continue...However, we have options!
1 Emergency rate hike
2 Intervention
3 IMF
4 Fiscal spending
5 Swap Lines
Now these are the options technically speaking we filled gap around 1.09 this morning, I expected 1.06 on table during open we hit lows of 1.03... Now, if we can hold the levels of these levels and perhaps go above 1.09 then no worries. However, if we carry on with these moves then things will get very interesting and keep an eye on the Gilt & FTSE!
Now it all looks very dismal when it comes towards headlines but actually there are coming amazing investment opportunities the prices we are getting and of course if you're in USA, what a great time for you to visit! For Candle stick traders - dragon fly!
Keep alert of what happens next, this week we have a lot speakers out of CB's and most importantly trade your plan!
Best,
TJ

GBPUSD STRUCTURE As your trade doctor is here to cure you from analysis paralysis and remove you from a state of confusion, this is the structure we will be following, the weak high has to be taken out before we can look for sells because we are already in the 4H supply zone but without the 15 minute we cannot confirm that the 4H is pilling back for a sell trade, do well to like share and follow.

GBPUSD BEARSHello Traders.
Another week is here to maximize market opportunities.
GBPSD has been in a range zone.
Zone ranging 1.2750 & 1.2700.
Previous week we saw bears breaking support zone then
closing the week back at resistance level 1.2745.
Support Zone 1.2700.
All systems from my POV look green for bears on H4
timeframe.
Bulls would only confirm a continuation if we see a close above 1.2760.
