TKOUSDTHello friends, today you can review the technical analysis idea on a 1D linear scale chart for TKOUSDT
Ttarget
0.57
stoploss
0.24
profit 100%
TKOUSDT trade ideas


TKO hold 6600 level and rideTKO has broken 6600 resistance .
BTC need to hold 63500 level and we are good to go
stoploss breaking below 6500

#TKO/USDT
#TKO
The price has been moving in a descending triangle since the beginning of 2023
We are now on the verge of breaking that channel
Powered by a moving average of 100
Now we have an upward trend on two levels
Current price 0.2571
First target 0.3614
Second goal 0.4434.

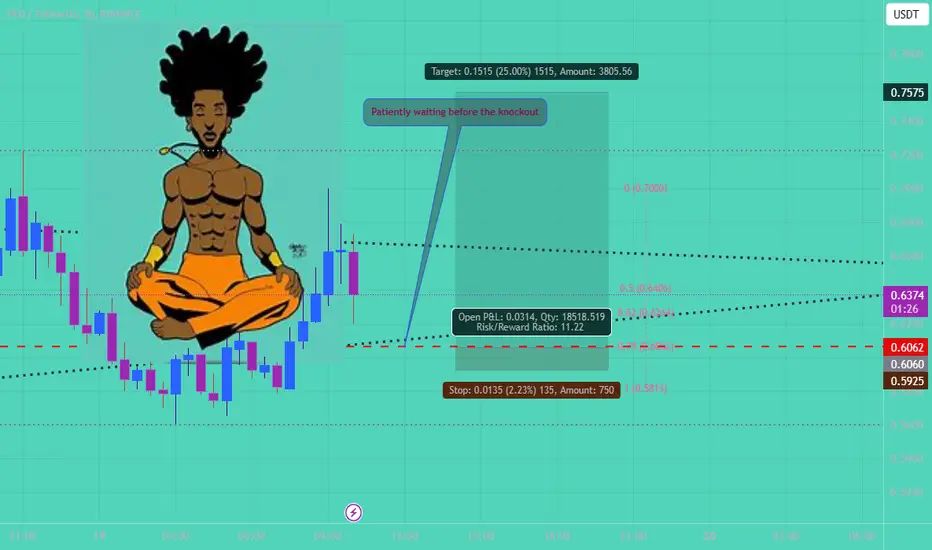
Exercising Patience and setting my Entry at your SL30 min trade bounce of the 70 fib..ABCD. I've notice that 25% is easier than 100%
TKOUSDT Trading opportunityTKO seems to have completed a five-wave drop pattern, signaling a potential shift towards an upside movement. There's anticipation for a probable ADAM and EVE formation, which indicating a change in the market sentiment.
The accumulation zone highlighted on the chart stands out as a crucial Point of Interest (POI) for a significant buy opportunity. It's advisable to set a wider stop loss to accommodate market fluctuations during this transition phase.
The pattern's Neckline emerges as an immediate zone for the mid-term target area and the proposed final setup target were shown on the chart.
Your comments and the likes received for this analysis are not simply valued; they actively inspire and motivate us to delve deeper into market analyses.

#TKO#tkousdt
Testing Falling Wedge In Daily Timeframe In case Of Breakout Expecting 100% Bullish Rally

TKOUSDT TODAY1-Apply your own risk management or follow Precisely my management.
2-Daily and Weekly Targets
3-Raise Often Your SL to protect your profits.
4-Use 10% SPOT
NYSE:TKO IS COMING

TKO ANALYSIS (1D)It seems that we have had a big diametric, and now we are in the G wave of this diametric, which is the final wave.
The G wave looks like a triangle as we are in the final microwaves.
If it returns to the green box, we can enter this symbol for TPs. Above the green range, we will not enter this symbol
Do not enter the position without setting stop and capital management. When we reach the first target, save some profit and then change the stop to entry

TKOUSDT IDEAHello Traders Hope You Are Enjoying Our Analysis. We Will Discuss About TKO
Seems Like Good Move Breakout & Retest Has Already Confirmed Expecting 2-3 Bullish Rally In Midterm ✍️

TKOUSDT - Bullish PatternPrice action is bullish and some sideways oscillation will move the trend up. Getting out of the accumulation zone always helps to ride a trend when there are no visible signs of divergence.

TKOUSDT in bullish trend TKOUSDT in bullish trend
we can trade on current market price SL below previous HL

TKO / TKOUSDTGood Luck >>
• Warning •
Any deal I share does not mean that I am forcing you to enter into it, you enter in with your full risk, because I'll not gain any profits with you in the end.
The risk management of the position must comply with the stop loss.
(I am not sharing financial or investment advice, you should do your own research for your money.)

TKOUSDT.4HBased on the provided market data for the TKO/USDT pair, here is the technical analysis:
1. The current price of TKO stands at 0.290 USDT.
2. The Relative Strength Index (RSI) over different time frames (4h, 1d, and 7d) are 46.45, 49.81, and 57.87 respectively. This indicates that the coin is neither overbought nor oversold. The RSI for 7 days is slightly higher which indicates a stronger buying pressure over the last week.
3. The Moving Average Convergence Divergence (MACD) for 4h and 1d are -0.0008 and 0.0020 respectively, which indicates a bearish signal. However, the MACD for 7d is 0.0088 which indicates a bullish signal.
4. The Bollinger Bands (BB) for 4h, 1d, and 7d are 0.3037, 0.3051, and 0.3051 respectively. The current price is below the middle band in all cases, indicating the possibility of an upward movement.
5. The support levels are gradually decreasing over time, indicating a bearish trend. However, the resistance levels are increasing, which suggests bullish sentiment.
In conclusion, the market data shows mixed signals. The RSI suggests a neutral to slightly bullish market, while the MACD shows bearish signals in the short term but bullish in the longer term. The Bollinger Bands also suggest a possible upward movement. The increasing resistance levels indicate bullish sentiment, but the decreasing support levels show bearish sentiment.
Please note that this is only a technical analysis and does not take into account other factors that could affect the price. It's recommended to combine this with fundamental analysis and your own research before making any investment decisions.

TKOUSDT IDEAHello Trading view Family / Fellow Traders.
I hope you have used and benifited from the previous analysis .
In today trading session we are monitoring TKOUSDT for a buying opportunity,
TKOUSDT UPDATE
Descending triangle Breakout & Retest Has Almost Completed Expecting an energetic move 📈
Here it has maximum chance we can see price around 0.4500💰 in coming days ✍️

TKOUSDT IDEAHey traders hope you are enjoying our analysis. Now we are here again with a new trading opportunity. We will discuss today about TKO
TKO Falling Wedge Breakout Has Already Done in 1W Timeframe ✅
Expecting 200%Bullish Wave

TKOUSDT.1DBased on the provided market data, the TKO/USDT pair is currently trading at $0.32. In the 4-hour timeframe, the Relative Strength Index (RSI) stands at 60.12, indicating a slightly bullish momentum. The Moving Average Convergence Divergence (MACD) is also positive, reinforcing this bullish sentiment. The Bollinger Bands (BB) are at $0.34, suggesting that the price is near the lower band, which might be a good buying opportunity. The resistance levels are at $0.3372, $0.3535, and $0.3640, while the support levels are at $0.3151, $0.2961, and $0.2772.
The daily timeframe shows a stronger bullish momentum with an RSI of 78.29 and a positive MACD. The BB is at $0.3390, which is slightly above the current price. The support levels are at $0.2834, $0.2553, and $0.2263, while the resistance levels are at $0.3398, $0.3655, and $0.3972.
For the 7-day timeframe, the RSI is at 64.73, indicating an overall bullish momentum. The MACD is also positive, showing a bullish trend. The BB is at $0.3336, slightly above the current price. The support levels are at $0.2417, $0.2036, and $0.1728, while the resistance levels are at $0.4360, $0.5870, and $0.9880.
In conclusion, the TKO/USDT pair is showing bullish signs in all the given timeframes (4-hour, daily, and 7-day). However, it's important to keep an eye on the support and resistance levels, as a break above or below these levels could indicate a potential trend reversal. As always, this analysis should not be considered as financial advice, and you should do your own research before making any investment decisions.

TKO🐳#TKO (x50)
🌀0.2415 USDT
💵12.5 USDT
💸No SL
------------------------------
Tokocrypto Digital Exchange is the leading regulated digital asset exchange and one of the largest fiat-crypto exchanges in Indonesia.

Tokocrypto Potential Up to Sky-High Upside of 0.67! Tokocrypto, one of the exchange in the world based on Indonesia and one of Binance subsidiary company that has in the same industry.
The charts are painting an awe-inspiring picture, signaling a potential ascent to 0.67.
Is the Bull Run narrative can boost this?

Toko Token (TKO) completed setup for the next pumpHi dear friends, hope you are well and welcome to the new trade setup of Toko Token (TKO) with US Dollar pair.
Previously we caught almost 57% pump of TKO as below:
Now on a daily time frame, TKO has formed a bullish Gartley move for the next pump.
Note: Above idea is for educational purpose only. It is advised to diversify and strictly follow the stop loss, and don't get stuck with trade.

TKOUSDT WILL RISE AGAIN1-Apply your own risk management.
2-Daily and Weekly Targets
3-Hunt the profits at any level you see convenient for you.
4-Gonna SPOT IT WITH 7%
have a good day guys.

Tko binance launchpad project long term analysis Nothing to talk much 😜
We know it's an exchange 💱 token 📌 but very High risk so pls #dyor
I provided you best areas 😉 everything on chart 📉📈
CRYPTO:TKOUSD is binance launchpad token still no performance ☺️
last time POLONIEX:WRXUSD done 600X
It is also BINANCE launchpad project so I am hoping same thing to get repeated 👍
Anything just comment below share to ur frnds and family 📌
Support by boosting 🚀
Follow this article u get updates when I updated here. 💝

🔥TKO Is At The Buy Point: +100% is The Closest TargetTokocrypto is below huge accumulation channel. The return inside it will be a HUGE buy signal.
The closest solid target is at the top of the channel (+100%). If the channe will be broken above, the test of it as the support will be additional buy signal with the target at $1-1.2. It's +350-400%.
💥next gainer of the week?
like❤️ and follow
Check the links and get a BONUS🎁 from me👇
