HKDJPY trade ideas


HKDJPY technicaly based
📌Short intro:
I am full time trader - analyst * High accuracy of ideas * Technicaly and Fudnamentaly side in analysis * Comment if have any questions or want to send support * Price action - FIBO - Candl pattern * FX - STOCK - CRYPTO * Simple ideas
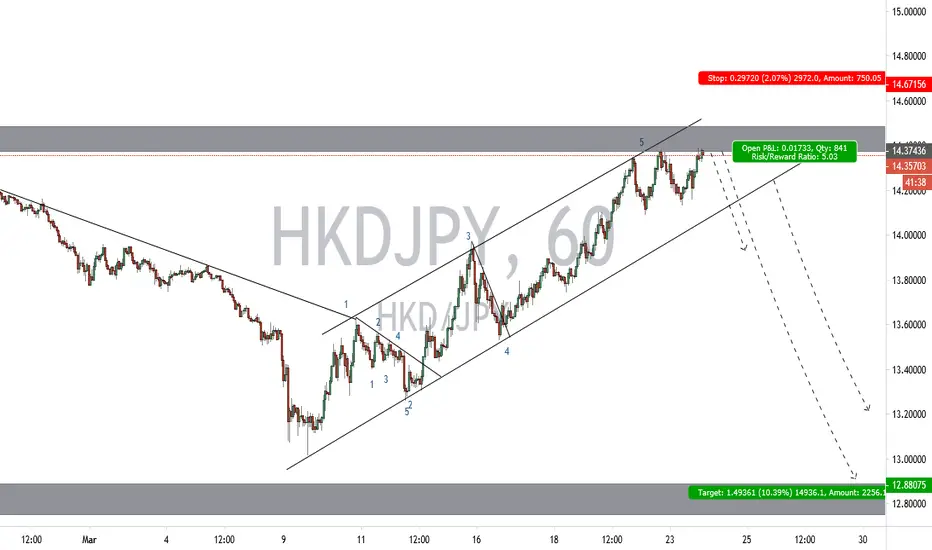
💡 HKDJPY technicaly based idea, candlels foramtion good bearish, we can see price is bounce from last supp zone (yellow line) expecting to see push down in price till FIBO 0.382 which is in same time and support zone.
📌Have on mind, trading involves risk, check idea on your own tactic, if have questions pls comment!
Thanks on supporting!
All best, good luck!

HKDJPYThere's many ways to trade this fall. Wait for sharp move down and retracement and jump in. Or wait for breake out of the trend line.
HKDJPY expecting higher bearish continuation technicaly based
ENTRY: 13.550
TP: 13.400
TP2: 13.200
TP3: 13.000
SL: 13.650
Chart time frame - 1W
Time for reaching TP - 1-2W
Follow, Like, Share or Comment
Thanks on supporting!
All best!

HKDJPY expecting bearish continuation in next period
ENTRY: 13.88000
TP: 13.83000
TP2: 13.78000
TP3: 13.73000
SL: 13.96000
Chart time frame - 1D
Time for reaching TP - 1-3D
Follow, Like, Share or Comment
Thanks on supporting!
All best!

HKDJPY Buy SignalPattern: 1D Channel Up.
Signal: Bullish on the next Higher Low (typically the 1D MA50 supports and the RSI goes within 50.000 - 45.000).
Target: 14.1500 (projected Higher High of the pattern).


Basic chart patterns (triangles) HKD/JPY Title says it all. this is basic, but powerful, triangles used for simple charting and with entry/profit levels this can't get much better can it.?
Stay tuned for more
Dont forget to give the post a like
Thank you so much for all the support - I appreciate it a lot !

HKDJPY Trade the break outPattern: Channel Down on 1D.
Signal: Bearish (1) if 13.7436 breaks. Bullish (2) if it holds or the Lower High trend line breaks upwards.
Target: TP(1) = 13.6000, TP(2) = 14.1000.

HKDJPY Buy SignalPattern: 1D Channel Up.
Signal: Bullish if the Higher Low sequence on 4H holds.
Target: 14.2500 (4H Resistance).

HKD/JPY Bullish !This pair is currently in an micro uptrend and still expecting it to see further upside
What I plan on doin on this trade is ...
Enter: 14.5719
Target: 14.76
Stop Loss: 14.4938

The FUTURE High / Low price swing dates for HKDJPYThese are the FUTURE dates for HKDJPY with the highest probability for experiencing a price
swing high or low. Apply your own indicator(s) to determine the price swing direction.

The Future High / Low price swing dates for HKDJPYThese are the FUTURE dates for HKDJPY with the highest probability for experiencing a
price swing high or low. Apply your own indicator(s) to determine the price swing direction.

HKDJPY: Target hit. 1W Channel Up intact. Long.TP = 14.41427 hit as the 1W Channel Up (RSI = 56.437, MACD = 0.090, B/BP = 0.2883) rose to a 14.6150 Higher High. The price has since pulled back in order to price a new Lower Low, which should be near 14.200 (Highs/Lows = 0.0000). We will be going long on HKDJPY with TP = 14.600.

1W Channel Up. Long.HKDJPY is rising having made a Higher Low on the long term 1W Channel Up (RSI = 59.227, MACD = 0.035, Highs/Lows = 0.0546, B/BP = 0.1578). We expect to crosse the pivot (blue dotted line) swiftly as the buying pressure on 1D (RSI = 60.972, overbought on 3) accelerates. Consequently we are going long, TP = 14.41427 (previous Higher High) and 14.51650 (potential new Higher High) in extension.

1D Resistance test. Expecting rejection. Short.HKDJPY is currently testing the 14.19330 Resistance on the 1D Rectangle (MACD = 0.029, Highs/Lows = 0.0662, B/BP = 0.1221). Initiating a short, TP = 13.93664.


HKDJPYTrading method: RSADVANTAGE Stage 5, accurate system manually forward tested over 3 years designed to stay out of ranging markets and only target strong trends suited for swing trading. This system is made of custom adaptive volume indicators and Oscillators that properly detect trends very early and provides exit signals at dynamic S/R zones once the trend has ended. // Average yearly pips gained is 40k per pair on D1 charts alone. I have provided a similar limited version of the system on Trading view to help traders visualize the strategy.
HKDJPY
To open SHORT positions for HKDJPY , it is required:
In this situation our system indicators to confirm trade entry confirmation for movement to the downside but if the market trend continues to range this signal will become invalid and we can see this pair climb to new highs. Market execution for entry, I will confirm signal once the conditions have been met.
Risk Description: Once signal is confirmed we will basket trade into the position on H1 and minimum 100 pips will be up for grab with small risk SL at swing high. Target 200 pips
Profit expectations: 1-4 day trade length expected before hitting profit target I will post exit strategy when signal receives a exit signal.

Tripple Top HKDJPYHKDJPY the market has reached a triple top. Therefore it's time to sell. but wait for that support level indicated as a green horizontal line. make a SL at the top of the final two tops.

HKD/JPY 1H Chart: Channel DownThe Hong Kong Dollar has formed a channel down against the Japanese Yen in force since early July.
The rate failed to reach the lower boundary of the channel down during its last wave south, suggesting that the sentiment may soon change in favour of bulls. A confirmation of this move could be provided when the rate moves above the 55-, 100– and 200-hour SMAs near the 13.99 mark.
Gains could be limited by three weekly pivot points. Meanwhile, the upper limit is likely to be the monthly PP at 14.48 in case strong upside risks dominate the market.

HKD/JPY 1H Chart: Channel DownThe Hong Kong Dollar has weakened considerably against the Japanese Yen. Its latest fall started mid-July and resulted in the formation of a channel down. Moreover, the pair is likewise trading in a minor symmetrical triangle. The exchange rate, however, failed to reach the upper boundary of the latter in its last surge and consequently returned back at its bottom line circa 14.20. Thus, the given pattern may be breached to the downside next week. Despite bearish technical indicators, it is quite likely that the Hong Kong Dollar still manages to push higher until the upper channel boundary in the 14.28/32 area, reinforced by the 50% Fibonacci retracement. Nevertheless, the given currency still needs to surpass the 55-, 100– and 200-hour SMAs and the monthly PP near 14.28 along the way. If these levels halt the pair, a breakout is to occur even sooner.

HKD/JPY 4H Chart: Channel DownHKD/JPY 4H Chart: Channel Down
The Hong Kong Dollar is depreciating against the Japanese Yen simultaneously in medium-term and short-term descending channels.
The junior pattern represents a second rebound of the currency exchange rate from the upper trend-line of the senior formation.
It seems that in the early Wednesday morning the pair has already bounced off from a combined support level set up by the 200-period SMA and the weekly S1 at 14.3165.
Hence, the question of the day is whether the rate will manage to break through the junior channel‘s upper edge or it will make a rebound and continue to move downwards.
Due to the narrowness of this formation, the first scenario seems very possible.
However, even if it realizes, the surge most probably will be limited by the 55- and 100-period SMAs with the weekly PP at 13.4863.
