GMXUSDT IDEAHello Traders Hope You Are Enjoying Our Analysis. Today We Will Discuss About GMX
(Update)
The Ascending Channel Formation On 6H Timeframe⏳
In Case Of Successful Breakout Expecting Massive Bullish Wave☑️
Targets>
39$
40$
GMXUSDT.P trade ideas

Rising Steadily ---- GMXAlthough the first TVL ranking on Arbitrum has been taken away by Pendle. But it is undeniable that GMX is one of the most innovative protocols in last year, bringing a liquidity provider experience different from Uniswap. While LP collects protocol fees, it can also receive losses from the counterparty, traders, which provides professional investors and institutions with a good financial tool. This is why GMX’s mechanism has been forked by many protocols
As a derivatives DEX, trading volume is the most critical fundamental indicator. After entering 2024, the average daily trading volume on GMX gradually increased and was higher than that in 2023. But on price, GMX will significantly underperform the market in 2024. This is most likely because the circulation of GMX is close to 100%, so there isn’t so much for a premium in the pricing. This does not affect its bullish trend, it just makes rising more stable.
Judging from the candle chart, the continuity of bulls is not strong at the 4h level. A short-term rise and a long-term correction. If you don't have the aid of good indicators, even if you open a long position at a cheap price, you may still close the long position during the pullback.
On May 10, the TSB indicator prompted a BUY signal, which meant a long position signal. You can see that GMX then started to rise and the bulls strengthened every time the columns approached the wavy zone. You don't need to pay attention to the changes of the candles, the TSB indicator can easily help you hold the position.
Introduction to indicators:
Trend Sentinel Barrier (TSB) is a trend indicator, using AI algorithm to calculate the cumulative trading volume of bulls and bears, identify trend direction and opportunities, and calculate short-term average cost in combination with changes of turnover ratio in multi-period trends, so as to grasp the profit from the trend more effectively without being cheated.
KDMM (KD Momentum Matrix) is not only a momentum indicator, but also a short-term indicator. It divides the movement of the candle into long and short term trends, as well as bullish and bearish momentum. It identifies the points where the bullish and bearish momentum increases and weakens, and effectively capture profits.
Disclaimer: Nothing in the script constitutes investment advice. The script objectively expounded the market situation and should not be construed as an offer to sell or an invitation to buy any cryptocurrencies.
Any decisions made based on the information contained in the script are your sole responsibility. Any investments made or to be made shall be with your independent analyses based on your financial situation and objectives.

GMX is starting to move.. GMX is bullish today
We have some buy signals with an uptrend
This coin was been sleeping until now..
My brother has it and he was upset that it doesnt move :))
Take Care !

GMXUSDT-Buying Opportunity-Ready For Bullish WaveDear Traders,
We are convening a discussion focused on #GMXUSDT
THE Trendline Breakout Has Already Done ✅
On a Weekly Support Level ✅
So,I Expect a Bullish Move of 100% In Coming Days 🚀😉
Regards: AnnaTradeCharts
#Bitcoin #Crypto #Ethereum #Cryptocurrency #CryptoTrading #BTCUSDT #ETHUSDT #ALTCONS #USDT CRYPTOCAP:BTC CRYPTOCAP:ETH CRYPTOCAP:USDT CRYPTOCAP:PEPE CRYPTOCAP:DOGE NASDAQ:ALT

Swing setup for GMX - Safe 50% profitReally not liking this coin, but a trade is a trade. Think this is a pretty safe setup, so basically we should see a push towards 40$ coming weeks, which would be a nice 50% profit.
Opened a small long here at current levels :)
Stay safe!

GMXGMX is a decentralized spot and perpetual exchange that operates on the Arbitrum and Avalanche blockchains, offering traders low swap fees and zero price impact trades. It leverages a unique multi-asset pool that provides liquidity for trades and earns yield from market making, swap fees, and leverage trading.
Given GMX's innovative approach to decentralized trading and its recent market trends, the next price targets for GMX could be $36, $44, and $52. Investors might consider capitalizing on this upward trend by entering a position at the current level. This trading idea is predicated on the continued growth and innovation in the DeFi sector, with GMX positioned as a key player due to its unique trading features and liquidity solutions.

GMX ???Hi.
COINEX:GMXUSDT has broken out of an ascending triangle pattern with good volume, the 100-day moving average and Ichimoku cloud suggest a bullish trend 🧐
AB=CD
The bullish move may continue after a successful retest of the triangle 👨💻
Stay awesome my friends.
_ _ _ _ _ _ _ _ _ _ _ _ _ _ _ _ _ _ _ _ _ _ _ _ _ _ _ _ _ _ _ _ _
✅Thank you, and for more ideas, hit ❤️Like❤️ and 🌟Follow🌟!
⚠️Things can change...
The markets are always changing and even with all these signals, the market changes tend to be strong and fast!!

GMX: Ascending Triangle BreakoutTrade setup : Bullish breakout from Ascending Triangle could signal a bullish trend reversal with near-term upside to $40-$43 resistance zone. That's a stiff resistance area as it also lines up with 200-day moving average. Overall, price remains in a downtrend until it breaks back above that 200-day MA.
Pattern : Ascending Triangle which is a continuation pattern (it typically breaks out in the direction of existing trend). Most traders wait for a breakout but Swing traders could trade between the trendlines (Buy at Support, Sell at Resistance) as long as the trendlines are still relatively far apart. Learn to trade chart patterns in Lesson 8.
Trend : Short-term trend is Up, Medium-term trend is Neutral and Long-term trend is Strong Down.
Momentum is Bullish but inflecting. MACD Line is still above MACD Signal Line but momentum may have peaked since MACD Histogram bars are declining, which suggests that momentum could be nearing a downswing. Price is neither overbought nor oversold currently, based on RSI-14 levels (RSI > 30 and RSI < 70).
Support and Resistance : Nearest Support Zone is $30.00, then $24.00. Nearest Resistance Zone is $40.00.

GMXUSDT IDIAHello traders hope you are enjoying our Analysis.
Now we are here again with a new trading opportunity ,we will discuss today about GMXUSDT
Running in almost +45% profit so far.

GMXUSDT UPDATE#GMXUSDT(Update)
Hey dear traders. Hope you are enjoying analysis with our team. we are here to analyze GMXUSDT today.
Running in 28%+ profit ✅
Expecting more in coming days📈🚀

GMXUSDT is BullishPrice is consistently printing higher highs and higher lows, after bullish divergence appeared on 1H time frame. According to Dow theory, HH's and HL's are classic signs of bullish rally, hence new highs are expected. Targets are mentioned on the chart.

GMXUSDT (Bullish)Harmonic Pattern Completion: If the pattern completes, the price might rise towards the D point, which is typically at the 88.6% retracement of XA.
Fibonacci Support: The 61.8% Fibonacci level (27.63) is a strong support zone, suggesting a possible reversal from this point.
Elliott Wave Theory: The corrective wave (ABC) aligns with the harmonic pattern, adding confluence to the analysis.
-The analysis suggests a potential bullish reversal from the current level (around 27.68), aiming towards the D point of the harmonic pattern. However, keep an eye on key support levels and validate the pattern completion with price action before making any trading decisions. Always consider using stop-loss orders to manage risk.

GMXUSD, Consolidation phase is near to endHi, traders. Welcome to our cryptocurrency community! 🚀Whether you're an experienced trader or just getting started in the world of cryptocurrencies, we're delighted to have you here.
We are willing to talk about the GMXUSDT coin.
#GMXUSDT
Update: 💹.
During the 12-hour period, #GMXUSDT moved in a descending channel.
It breaks the resistance and forms a range zone 📊 💰.
Once it breaks through this zone and closes above it.
A significant bullish rally is expected.
Expect a nearly 100% increase in the mid-term. 👉✅.

GMXUSDT UPDATE #GMXUSDT
UPDATE
Hey all friends and traders. Hope you are enjoying our analysis. we are here to analyze GMXUSDT today.
Falling wedge Breakout done in 12H time frame.
Expecting Massive Bullish wave towards 90%+ 📈

GMXUSDTmy entry on this trade idea is taken from a point of interest ABOVE an inducement.. I extended my stoploss area to cover for the whole swing as price can target the liquidity there before going as i anticipate.. just a trade idea, not financial advise

GMX Triple Bottom?GMX is a Decentralized Perpetual Exchange. I use it, and as the old adage says: "Buy What You Use".
gmx.io
Yes the SEC is suing Uniswap and probably other decentralized exchanges. The last time I checked, the SEC doesn't have jurisdication over the world and is only protecting Americans from scams like FTX and buying Bitcoin under $300 when the first ETF was proposed.
The thesis for GMX:
A utility token where holders will get fees from traders using the exchange.
If we do have a long-term bear market, GMX will allow people to short or hedge their positions.
Technicals:
- All Time Low was hit yesterday.
- Triple bottom.
Stop loss: weekly close below $23.

GMXUSDT UPDATE#GMXUSDT
UPDATE
Wedge formation in weekly Time frame
In the case of upside breakout Expecting 2oo%+📈

GMXUSDT UPDATETSX:GMX
UPDATE
TSX:GMX is making inverse head and shoulder pattern. And almost ready for breakout. After this Breakout we can see gain upto 25%+ soon✍
#GMX #GMXBTC #GMXUSDT #CRYPTO #BNB #CRYPTO #POUND

GMX LONG SETUP ALL trading ideas have entry point + stop loss + take profit + Risk level.
hello Traders, here is the full analysis for this pair, let me know in the comment section below if you have any questions, the entry will be taken only if all rules of the strategies will be satisfied. I suggest you keep this pair on your watchlist and see if the rules of your strategy are satisfied. Please also refer to the Important Risk Notice linked below.
Disclaimer


GMX cycle rotationRotations are great. Cycles repeat.
Im watching and waiting for bull divs to form on my nami indicator momentum waves with clear signals.
I do believe GMX is a solid project and will rotate back up.
Im looking to paper trade long because i simply do this for fun. wink.
Not
Financial
Advice
Ever

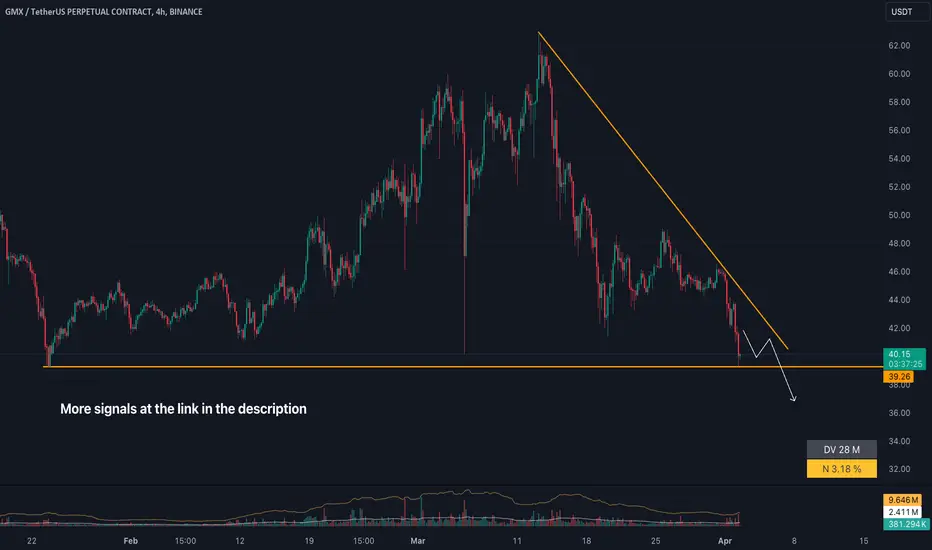
SHORT #GMXUSDTSHORT #GMXUSDT from $39.39
4h TF. Attention! A signal to test the level confirmed by several touches. The volumes are falling. The seller is active. The instrument removed liquidity from 59.95. According to the law of reverse liquidity. Namely, the price will tend to the level of the beginning of the impulse that launched this movement. At the breakdown, be ready!! To the stake. If everything goes smoothly, the goal is 36.18. We close the imbalance with abnormal volumes.
GMXUSDT DailyHi Dear Friends
based on Waves theory I think a good opportunity on this chart, please let me know what you think!!!
Best regards!
