EURGBP trade ideas

EURGBP H4 | Bullish breakoutThe price is breaking out of the pullback resistance and could potentially rise to the take profit level.
Buy entry is at 0.86825 which is a pullback resistance.
Stop loss is at 0.86479 which is a level that sits under a multi-swing low support.
Take profit is at 0.87433 which is the overlap resistance level.
High Risk Investment Warning
Trading Forex/CFDs on margin carries a high level of risk and may not be suitable for all investors. Leverage can work against you.
Stratos Markets Limited (www.fxcm.com):
CFDs are complex instruments and come with a high risk of losing money rapidly due to leverage. 67% of retail investor accounts lose money when trading CFDs with this provider. You should consider whether you understand how CFDs work and whether you can afford to take the high risk of losing your money.
Stratos Europe Ltd, previously FXCM EU Ltd (www.fxcm.com):
CFDs are complex instruments and come with a high risk of losing money rapidly due to leverage. 72% of retail investor accounts lose money when trading CFDs with this provider. You should consider whether you understand how CFDs work and whether you can afford to take the high risk of losing your money.
Stratos Trading Pty. Limited (www.fxcm.com):
Trading FX/CFDs carries significant risks. FXCM AU (AFSL 309763), please read the Financial Services Guide, Product Disclosure Statement, Target Market Determination and Terms of Business at www.fxcm.com
Stratos Global LLC (www.fxcm.com):
Losses can exceed deposits.
Please be advised that the information presented on TradingView is provided to FXCM (‘Company’, ‘we’) by a third-party provider (‘TFA Global Pte Ltd’). Please be reminded that you are solely responsible for the trading decisions on your account. There is a very high degree of risk involved in trading. Any information and/or content is intended entirely for research, educational and informational purposes only and does not constitute investment or consultation advice or investment strategy. The information is not tailored to the investment needs of any specific person and therefore does not involve a consideration of any of the investment objectives, financial situation or needs of any viewer that may receive it. Kindly also note that past performance is not a reliable indicator of future results. Actual results may differ materially from those anticipated in forward-looking or past performance statements. We assume no liability as to the accuracy or completeness of any of the information and/or content provided herein and the Company cannot be held responsible for any omission, mistake nor for any loss or damage including without limitation to any loss of profit which may arise from reliance on any information supplied by TFA Global Pte Ltd.
The speaker(s) is neither an employee, agent nor representative of FXCM and is therefore acting independently. The opinions given are their own, constitute general market commentary, and do not constitute the opinion or advice of FXCM or any form of personal or investment advice. FXCM neither endorses nor guarantees offerings of third party speakers, nor is FXCM responsible for the content, veracity or opinions of third-party speakers, presenters or participants.

EG SELL IDEAEURGBP is in downtrend now price is making LH also double top on 4 hour and 1 hour look for break out to enter short

EURGBP: TECHNICAL ANALYSIS.Hello traders,
Wave 4 is supposed to end at 0.86330-0.86170 zone. Then ABC Correction is supposed to
materialise towards the resistance zone at 0.87010-0.87170.
Thanks.

EURGBP: Bearish Continuation & Short Signal
EURGBP
- Classic bearish pattern
- Our team expects retracement
SUGGESTED TRADE:
Swing Trade
Sell EURGBP
Entry - 0.8662
Stop - 0.8686
Take - 0.8613
Our Risk - 1%
Start protection of your profits from lower levels
❤️Please, support our work with like & comment!❤️

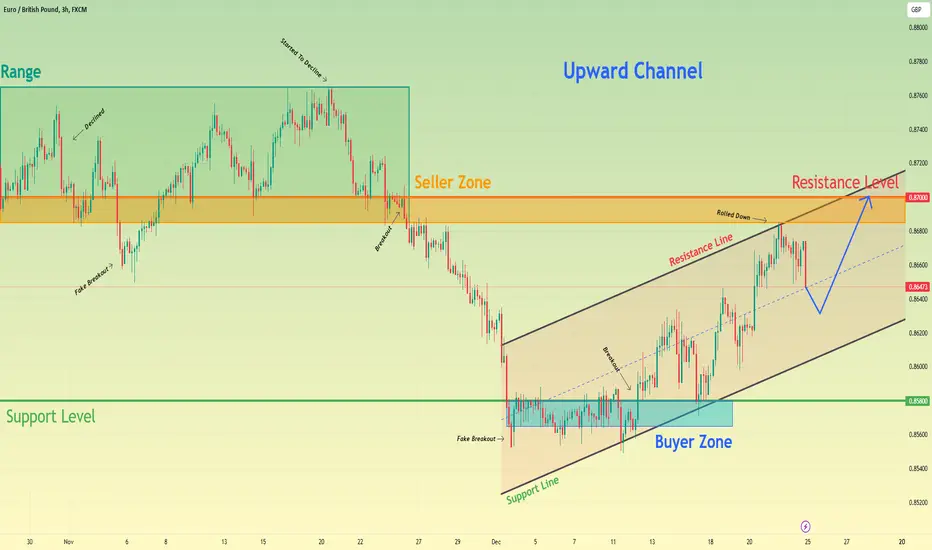
British Pound can make one more movement down and then bounce upHello traders, I want share with you my opinion about British Pound. Observing the chart, we can see that the price a few days ago started to trades in the range, where it first declined below the 0.8700 level, which coincided with the seller zone and bottom part of the range, but soon backed up, making a fake breakout. After this, the price rose to the top part of the range, bounced and in a short time EURGBP declined below the 0.8700 level again and even soon exited the range. Then the price fell lower than the support level, which coincided with the buyer zone, and later around up and started to rise inside the upward channel. In the channel, the price rose higher than the 0.8580 level and a few moments later reached the resistance line of the channel, which coincided with the seller zone. But not a long time ago, the British Pound rolled down and now it continues to fall. So, possibly price can decline a little more and then rebound up to the resistance level, which coincides with the resistance line of the channel. For this case, I set my target at this level - 0.8700. Please share this idea with your friends and click Boost 🚀
correction It is expected that a trend change will be formed in the current resistance range and a downward trend will be created. Then, the continuation of the downward trend can be formed up to the previous bottom range

EURGBP - Long AoL (Areas of Interest)Considering the fact that this pair is trading above the 200 SMA on both the daily and 4 hour timeframes, I'm looking for buy entry areas in this ascending channel formation.
On the chart I pointed out several areas which basically are along the ascending trendlines. If at any point I receive an alert of price action tagging one of these trendlines, I'll look for a potential long entry.
Now of course I can't expect to always be right and hopefully this isn't one of those setups where I'm wrong, so for that reason if PA decides to break and hold below the lowest ascending TL, I'll exit and book my loss.
That's it - That's all
Merry Christmas!

EURGBP ⬆️ Long Trade Setup ⬆️Hello Everyone 🙋🏽♂️
Triangle Pattern
💲 Entry Point : 0.86741 🟢 TP 0.87017 🔴 SL 0.86650
We are not responsible of any losses for anyone, our trades are profitable more for long terms and we take losses as everyone,
manage your lot size as well and your SL and TP and my opinion is 0.01 lot for each 500 $.
Don't forget to hit the like bottom and write a comment to support us.
Follow us for more 🙋🏻♂️
Best Regard / EMA Trading .
Disclaimer:
----------------
It's not a financial advise, As everyone we take losses sometime but for long term trading we are profitable traders, so manage your account well with SL and TP and your lot size to keep your account safe and stay in the market

EURGPB BEARISH DIVERGIEN AB=CD EURGPB is testing the point D and here it is clearly see the bearish divergien so you can open short position

EURGBP currency pair good in sell ??as per my analysis , eurgbp currency now going to change as down trend for proper rejection at 0.87300 is my rejction level and stoploss 0.87834

eurgbp Buy setup forming price broke structure , im expecting price to retrace down to that blue zone for a goosd risk reward ratio entry.
If you have any suggestion for the pair you wna check , hit me up, so we can break it down as a team

7 Dimension analysis for EURGBP 🕛 TOPDOWN - Navigating a Sideways Consolidation
Overview: This pair has been trading in a sideways range between 0.9501 and 0.8260 since 2017, establishing a considerable consolidation area. The monthly chart reflects a vast consolidation region, making it one of the most consolidated pairs in forex, lacking a clear direction. On the weekly chart, after forming a valid low, the pair initiates an upward move, seemingly with a short post-breakout buildup.
😇 7 Dimension Analysis
Time Frame: Daily
1️⃣ Swing Structure: Bullish
🟢 Structure Behavior: Break of Structure (BoS)
🟢 Swing Move: Corrective, nearing a valid Point of Interest (POI).
🟢 Inducement: Completed, forming a valid high, with prices approaching a potential buy area. Anticipating the 1st pullback, which might be deep at extreme levels. Internal structure appears bearish with an unmitigated overbought (OB) scenario.
🟢 Support/Resistance Areas: Support, Demand, Accumulation areas are vital, marked with trendlines. Identifying potential buy entries in these zones.
2️⃣ Pattern
🟢 CHART PATTERNS
Reversal
Double bottom formation indicative of a potential reversal.
🟢 CANDLE PATTERNS
Key Observations:
The last candle, a significant bear candle, indicates profit booking by climax players.
Momentum candles reflect strict bearish momentum, but bear in mind that substantial bear candles near support might not have significant implications.
Climax players' activity in the area warrants careful observation.
3️⃣ Volume: High volumes at both the beginning and end, signaling bullish volume. There's a high chance of price reversal or support emergence from these levels.
4️⃣ Momentum RSI:
🟢 Momentum State: In a sideways zone.
🟢 Divergence: Two consecutive bearish divergences indicate active bears, although a bullish divergence is currently forming.
5️⃣ Volatility Bollinger Bands:
🟢 Bands are below the middle band, suggesting a bearish trend. However, a punch from the upside signals strong bearish pressure.
6️⃣ Strength - ROC Values: EUR is stronger than the bears.
✔️ Entry Time Frame: Daily
✅ Entry TF Structure: Bullish
☑️ Current Move: Corrective
✔ Support Base: Previous support area
☑️ Candles Behavior: Climax player activity, record session count with an extreme bearish candle unable to break support.
☑️ Trend Line Breakout: Not yet observed.
☑️ Final Comments: Buy at the support.
💡 Decision: Buy once the price reaches the support area.
🚀 Entry: 0.8670
✋ Stop Loss: 0.8647
🎯 Take Profit: 0.8831
2nd Exit if Internal Structure Changes, 3rd Trendline Breakout, FOMO.
😊 Risk to Reward Ratio: 1:7
🕛 Expected Duration: 30 days
SUMMARY: The analysis focuses on a bullish scenario, given the corrective move and potential support areas. However, cautious optimism is advised, considering bearish momentum and climactic activity. The strategy revolves around waiting for the price to reach a key support level for a buy entry, aligning with the broader bullish outlook.

Long in EURGBPI have taken a long position in EURGBP as the price has recently touched a significant demand zone. This zone represents an area where buying pressure is expected to increase, potentially leading to a reversal in the currency pair's downward momentum.
Furthermore, the weakness in GBP can be attributed to the release of its CPI data a few days ago. This data revealed lower-than-expected inflation figures, which has put downward pressure on the currency. Taking this fundamental factor into consideration, along with the technical analysis of the demand zone, I have identified a favorable opportunity to go long in EURGBP.
As I closely monitor the price action, I remain vigilant for any signs of bullish momentum or strengthening demand. It is crucial to stay informed and adapt my trading strategy accordingly to maximize potential profits and manage risks effectively.
Trading in the forex market requires careful analysis and a disciplined approach. By adhering to a well-defined trading plan, utilizing technical indicators, and implementing proper risk management techniques, I aim to capitalize on this trading opportunity.
However, it is important to note that trading involves both opportunities and risks. Market conditions can change rapidly, and unexpected events can impact currency movements. Therefore, I will continue to stay updated on relevant news and adjust my position accordingly.
Successful trading requires a combination of skill, knowledge, and adaptability. By considering both technical and fundamental factors, I aim to make informed decisions that align with my trading strategy.
Remember, it is important to approach trading with a disciplined mindset, manage risk effectively, and make decisions based on thorough analysis. Best of luck with your EURGBP trades!

EURGBP H4 | Falling to supportEUR/GBP is falling towards an overlap support and could potentially bounce off this level to rise higher towards our take profit target.
Entry: 0.86547
Why we like it:
There is an overlap support level
Stop Loss: 0.85980
Why we like it:
There is a pullback support that aligns with the 61.8% Fibonacci retracement level
Take Profit: 0.87199
Why we like it:
There is a pullback resistance that aligns with the 78.6% Fibonacci retracement level
Please be advised that the information presented on TradingView is provided to Vantage (‘Vantage Global Limited’, ‘we’) by a third-party provider (‘Everest Fortune Group’). Please be reminded that you are solely responsible for the trading decisions on your account. There is a very high degree of risk involved in trading. Any information and/or content is intended entirely for research, educational and informational purposes only and does not constitute investment or consultation advice or investment strategy. The information is not tailored to the investment needs of any specific person and therefore does not involve a consideration of any of the investment objectives, financial situation or needs of any viewer that may receive it. Kindly also note that past performance is not a reliable indicator of future results. Actual results may differ materially from those anticipated in forward-looking or past performance statements. We assume no liability as to the accuracy or completeness of any of the information and/or content provided herein and the Company cannot be held responsible for any omission, mistake nor for any loss or damage including without limitation to any loss of profit which may arise from reliance on any information supplied by Everest Fortune Group.

EURGBP H4 | Breaking out of support levelPrice is in a downtrend, reaching our sell entry. It could breakout of the sell entry and reverse to the take profit level.
Sell entry is at 0.86587 which is an overlap support level.
Stop loss is at 0.86837 which is a level that sits above an overlap resistance and the 61.8% Fibonacci retracement level.
Take profit is at 0.86017 which is a pullback support level.
High Risk Investment Warning
Trading Forex/CFDs on margin carries a high level of risk and may not be suitable for all investors. Leverage can work against you.
Stratos Markets Limited (www.fxcm.com):
CFDs are complex instruments and come with a high risk of losing money rapidly due to leverage. 67% of retail investor accounts lose money when trading CFDs with this provider. You should consider whether you understand how CFDs work and whether you can afford to take the high risk of losing your money.
Stratos Europe Ltd, previously FXCM EU Ltd (www.fxcm.com):
CFDs are complex instruments and come with a high risk of losing money rapidly due to leverage. 72% of retail investor accounts lose money when trading CFDs with this provider. You should consider whether you understand how CFDs work and whether you can afford to take the high risk of losing your money.
Stratos Trading Pty. Limited (www.fxcm.com):
Trading FX/CFDs carries significant risks. FXCM AU (AFSL 309763), please read the Financial Services Guide, Product Disclosure Statement, Target Market Determination and Terms of Business at www.fxcm.com
Stratos Global LLC (www.fxcm.com):
Losses can exceed deposits.
Please be advised that the information presented on TradingView is provided to FXCM (‘Company’, ‘we’) by a third-party provider (‘TFA Global Pte Ltd’). Please be reminded that you are solely responsible for the trading decisions on your account. There is a very high degree of risk involved in trading. Any information and/or content is intended entirely for research, educational and informational purposes only and does not constitute investment or consultation advice or investment strategy. The information is not tailored to the investment needs of any specific person and therefore does not involve a consideration of any of the investment objectives, financial situation or needs of any viewer that may receive it. Kindly also note that past performance is not a reliable indicator of future results. Actual results may differ materially from those anticipated in forward-looking or past performance statements. We assume no liability as to the accuracy or completeness of any of the information and/or content provided herein and the Company cannot be held responsible for any omission, mistake nor for any loss or damage including without limitation to any loss of profit which may arise from reliance on any information supplied by TFA Global Pte Ltd.
The speaker(s) is neither an employee, agent nor representative of FXCM and is therefore acting independently. The opinions given are their own, constitute general market commentary, and do not constitute the opinion or advice of FXCM or any form of personal or investment advice. FXCM neither endorses nor guarantees offerings of third party speakers, nor is FXCM responsible for the content, veracity or opinions of third-party speakers, presenters or participants.
