EURGBP is ready to make bull movesthe trend is slowly moving towards bull run but it will be more clear if it breaks its last LH point
EURGBP trade ideas

EUR-GBP Local Long! Buy!
Hello,Traders!
EUR-GBP is already
Making a rebound from
The horizontal support
Of 0.8495 because
The pair was locally
Oversold so we will
Be expecting
A further move up
Buy!
Like, comment and subscribe to help us grow!
Check out other forecasts below too!

EURGBP: Long Trade with Entry/SL/TP
EURGBP
- Classic bullish formation
- Our team expects growth
SUGGESTED TRADE:
Swing Trade
Buy EURGBP
Entry Level - 0.8498
Sl - 0.8475
Tp - 0.8543
Our Risk - 1%
Start protection of your profits from lower levels
❤️ Please, support our work with like & comment! ❤️

EUR/GBP (euro-pound): two potential targets have been identifiedObserving the ongoing build-up on the Daily-timeframe graph, it could be inferred that the price has been developing for potentially upcoming bullish moves. Having spiked below the local key level and grabbed liquidity, we might imply that a bullish wave is ready to commence. Thus, having set buy positions with the stop-out order below the recent liquidity wick, we are having eyes on two key zones for making closures - both partial and full - and generating profits. With the total risk-reward set at an approximation of 1:4, we are being patient and awaiting further action from the price.
Nevertheless, there is no need to rush. As we know well, the market should and will do its thing regardless of our interpretation of it. Hence, the only thing that we could do is to follow our risk management plan, take a calculated guess, and have eyes on the long-term spectrum while remaining patient and composed at all times and costs.

possibility of changing the trend The price is expected to follow the indicated path and advance to the indicated support levels after making a new bottom. Then there will be a possibility of changing the trend.
If the price crosses the green resistance range, the upward trend up to the resistance range will be possible

Swing Sniper Signals Long for $EURGBPLong signal printed. Coming off bottom of bearish channel. Should be long @ market open up to 0.8590 (near top of channel and major supply zone).

EURGBP Buy ideaThe long position in EURGBP is initiated at the current market price of 0.85100, reflecting the favorable risk-reward profile. The first target is set at 0.85325, aligning with the entry point and representing an initial profit-taking opportunity. Subsequently, the second target is established at 0.85663, encompassing the potential upside trajectory based on comprehensive technical and fundamental considerations.

EURGBP HIT STRONG SUPPORTEURGBP for now Already HIT STRONG SUPPORT and STILL HOLD, We see at 2023, lower and HOLD around this Support, so we try to BUY it.

EURGBP potential upsidesHey Traders, in today's trading session we are monitoring EURGBP for a buying opportunity around 0.85100 zone, EURGBP is trading in an uptrend and currently is in a correction phase in which it is approaching the trend at 0.85100 support and resistance area.
Trade safe, Joe.

EUR GBP - LONGEUR GBP currently in a bearish trend,
but divergence has been printed
there's a possibility of reversal from this zone
long entry is recommended after the breakout of 0.85211

Eur Gbp long EUR/GBP Long Signal: Bullish Outlook
Analysis:
The EUR/GBP pair is showing a promising long signal, driven by a combination of technical patterns and fundamental factors suggesting upward momentum. Here’s a brief overview of the bullish outlook:
Technical Indicators:
Support Zone: EUR/GBP has found strong support around the 0.84700---0.84430 level, This support zone provides a solid foundation for potential upward movement.
Eurozone Economic Recovery: The Eurozone is showing signs of economic recovery, supported by robust manufacturing and services sector data. This positive economic backdrop strengthens the Euro against the British Pound.
The European Central Bank (ECB) is maintaining a relatively more supportive monetary policy stance compared to the Bank of England (BoE), which is grappling with inflationary pressures. This divergence in policy outlooks is likely to favor the Euro over the Pound.
The EUR/GBP pair presents a compelling long opportunity, supported by strong technical indicators and favorable fundamental factors. Traders should stay vigilant and adjust their positions as needed, keeping an eye on key economic data releases and geopolitical developments that could impact market dynamics.

EURGBPEURGBP has been on a downward trend for some days, I expect the downward movement to continue, from currently position, I am expecting EURGBP to move downward and make a new lower low.

EUR/GBP may rise 15 - 22 pipsOur pivot point stands at 0.8493.
Our preference
Rebound.
Alternative scenario
The downside breakout of 0.8493 would call for 0.8480 and 0.8473.
Comment
The RSI is above 50. The MACD is negative and above its signal line. The MACD must break above its zero level to call for further upside. Moreover, the price stands above its 20 period moving average (0.8504) but below its 50 period moving average (0.8507).
Supports and resistances
0.8541 **
0.8534 *
0.8527 **
0.8520
0.8505 last
0.8497
0.8493 **
0.8480 *
0.8473 **
Number of asterisks represents the strength of support and resistance levels.

EUR/GBPA bullish flag is a technical analysis pattern that indicates a potential continuation of an existing upward trend. It resembles a flag on a pole and is used by traders to identify short-term consolidation periods followed by a breakout in the direction of the prevailing trend. Here's an overview of the bullish flag pattern:
Structure of a Bullish Flag
1. **Flagpole**: This is the initial sharp upward movement in price, representing a strong bullish trend.
2. **Flag**: After the sharp rise, the price consolidates, moving in a small, downward-sloping or horizontal channel. This consolidation forms the flag part of the pattern.
3. **Breakout**: After the consolidation phase, the price breaks out of the flag pattern, continuing the upward trend.
Identifying a Bullish Flag
1. **Strong Uptrend**: Look for a strong upward movement (flagpole) in the price of the asset.
2. **Consolidation**: Identify a consolidation phase where the price moves sideways or slightly downward in a parallel channel (flag).
3. **Volume**: During the flag formation, the volume typically decreases, indicating a lack of strong selling pressure.
4. **Breakout**: A breakout from the flag pattern occurs with an increase in volume, resuming the upward trend.
Example
1. **Flagpole**: The price of a stock rises from $50 to $70 rapidly.
2. **Flag**: The price consolidates between $65 and $70, forming a downward-sloping channel.
3. **Breakout**: The price breaks out above $70 with increased volume, continuing the uptrend.
Trading the Bullish Flag
1. **Entry Point**: Enter the trade when the price breaks above the upper trendline of the flag with increased volume.
2. **Stop-Loss**: Place a stop-loss order below the lowest point of the flag to manage risk.
3. **Target Price**: The target price is usually estimated by adding the length of the flagpole to the breakout point.
Example Calculation
- **Flagpole Length**: $70 - $50 = $20.
- **Breakout Point**: $70.
- **Target Price**: $70 + $20 = $90.
Benefits and Risks
**Benefits**:
- **Clear Pattern**: The bullish flag is relatively easy to identify and trade.
- **Continuation Signal**: It signals the continuation of an existing uptrend, providing traders with a clear direction.
**Risks**:
- **False Breakouts**: There is a risk of false breakouts, where the price breaks out of the flag but then reverses.
- **Market Conditions**: The pattern is more reliable in strong trending markets and less effective in choppy or sideways markets.
Conclusion
The bullish flag pattern is a powerful tool for traders looking to capitalize on the continuation of an uptrend. By identifying the initial strong move, the consolidation phase, and the breakout, traders can set up trades with clear entry and exit points, effectively managing risk and potential rewards.

EURGBP longEURGBP seems bullish;
There is a bullish Divergence on RSI
There is a reversal pattern formed, Inverted Head and Shoulder.

4-hour EUR/GBP Inverse Head and Shoulders PatternInverse Head and Shoulders Pattern
Pattern Formation:
Left Shoulder: The first dip followed by a rise.
Head: A deeper dip than the left shoulder followed by another rise.
Right Shoulder: A dip similar in depth to the left shoulder followed by a rise.
Neckline: The horizontal resistance line connecting the highs of the left shoulder, head, and right shoulder. In this chart, the neckline is marked at approximately 0.85200.
Implications:
An inverse head and shoulders pattern typically indicates a reversal from a downtrend to an uptrend.If the price breaks above the neckline, it suggests a potential bullish breakout, signaling a buy opportunity.
Key Observations:
The EUR/GBP has been in a downtrend.
The pattern is forming at the end of the downtrend, indicating a possible reversal.
The price is currently near the neckline. A break and close above the neckline would confirm the pattern and could lead to further upside potential.
Trading Strategy:
Entry Point: Consider entering a long position if the price breaks and closes above the neckline (0.85200) with significant volume.
Stop Loss: Place a stop loss below the right shoulder to manage risk.
Target Price: Measure the distance from the head to the neckline and project it upwards from the breakout point to set a target price.
Risk Management:
Monitor the volume during the breakout. Higher volume increases the reliability of the breakout.Be cautious of false breakouts. Wait for a confirmed close above the neckline.

EURGBP - Setup IRBEntry:
- Sell at setup IRB
- Entry late
- There's still double bottom marked by red circle on the left side.
=> This entry is not so good.
Exit:
- Took 2R profit.
- Had some luck.


uptrend The uptrend is expected to advance to the resistance range. Then, according to the behavior of the price in this range, the continuation of the movement process will proceed according to the specified paths

EURGBP Harmonic Pattern Long Trade EURGBP Bullish IdeaEURGBP Harmonic Pattern Long Trade EURGBP Bullish Idea
Instant Entry or at Breakout of B point
and new Higher High.

EURGBPhello everyone, this is based on day tf, the price has reached strong support area, the price may get bullish and may breakout of 200ma.. currently the price did recover last Thursday after PMI news, while GBP dip with poor retail news.. some minor news for euro this week.. may recover more.. price dropped from 0.8532 to 0.8515 based on 15min tf ... price need to make new high above 0.8532 to show Euro in strength... 0.8532 is all time strong resistance area that need to break for price to remain bullish...

EURGBP LONG TERM Buying TRADING IDEAHello Traders
In This Chart EURGBP HOURLY Forex Forecast By FOREX PLANET
today EURGBP analysis 👆
🟢This Chart includes_ (EURGBP market update)
🟢What is The Next Opportunity on EURGBP Market
🟢how to Enter to the Valid Entry With Assurance Profit
This CHART is For Trader's that Want to Improve Their Technical Analysis Skills and Their Trading By Understanding How To Analyze The Market Using Multiple Timeframes and Understanding The Bigger Picture on the Chart

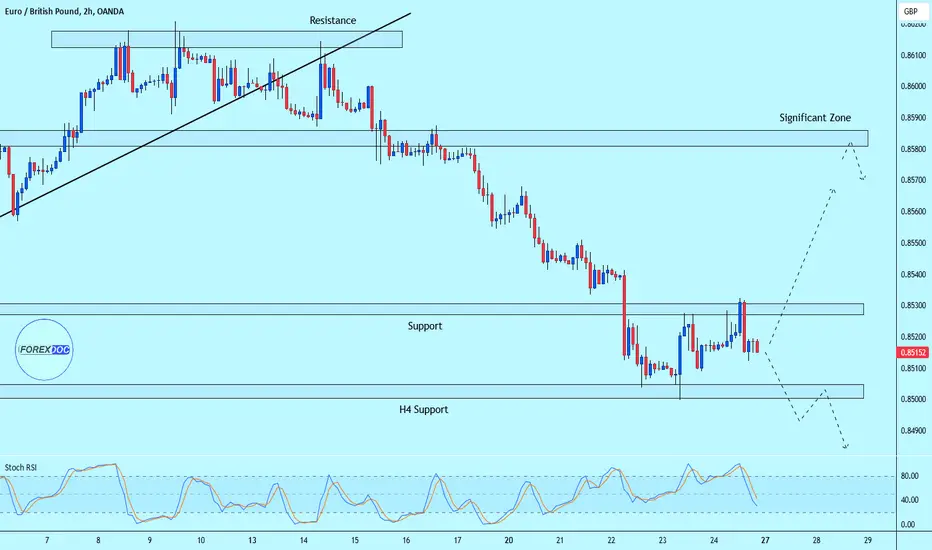
Very Strong Downtrend 🔴EUR/GBP H2
We can see very strong downtrend here. Price reacted to 0.85000 H4 support zone, but retested 0.85300 zone. It is possible to see bearish continuation, but if price breaks 0.85300 zone, I will look to buy.